Requested solution SEC 2011 Q1 - not sure if Paper 1 or 2 is required so I have linked below.
To explain the answer another way:
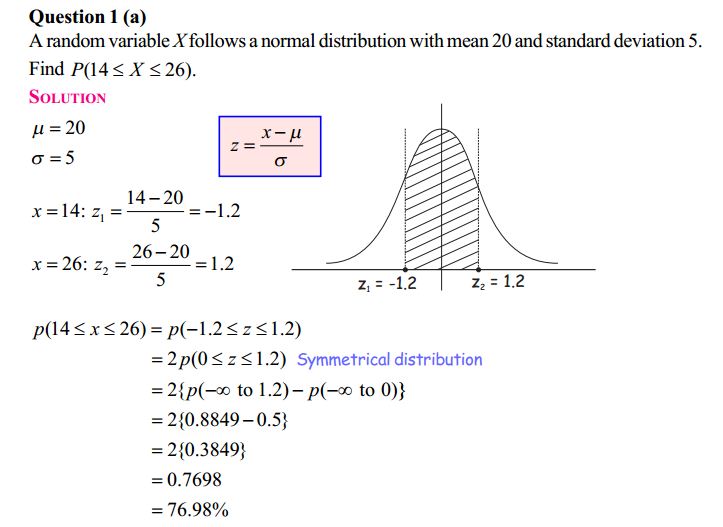
Once you have worked out that we want the probability between z=-1.2 and 1.2.
We then look up 1.2 in the z-tables and see it is = 0.8849 (or 88.49%).
Now consider the normal curve diagram: z = 0 is a probability of 50%.
Between 0 and 1.2 is 50% to 88.49% which is a difference of 38.49%.
By symmetry there is also the same probability between z = -1.2 and 0.
So the probability between -1.2 and 1.2 is 2(38.49%) = 76.98%.

 RSS Feed